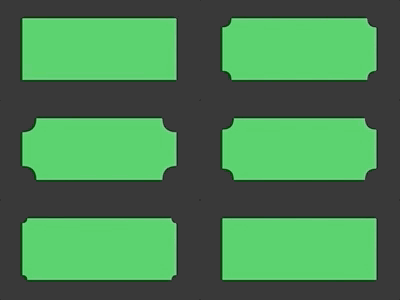
Hello and welcome to another blog post about SwiftUI. This time, we will talk about the animation of complex shapes in SwiftUI. You will understand animatableData property and will be able to implement animatable custom Shape struct that depends on multiple parameters.
AnimatableData
Animating simple shapes is easy thanks to animatableData property. We have seen an example of such animation in my previous post about custom controls. The magic behind animatableData is actually quite simple math. During the animation, the property value is being interpolated (or extrapolated in case of spring animation) from starting to the ending value according to the animation timing curve.
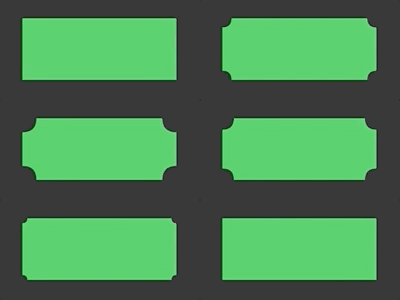
To demonstrate it once again, let’s start with a simple rectangle with cout-out rounded corners.
struct CoutOutRectangle: Shape {
    var cornerRadius: CGFloat

    var animatableData: CGFloat {
        get { cornerRadius }
        set { cornerRadius = newValue }
    }

    func path(in rect: CGRect) -> Path {
        return Path { path in
            let width = rect.width
            let height = rect.height

            path.move(to: CGPoint(x: cornerRadius, y: 0))
            path.addLine(to: CGPoint(x: width-cornerRadius, y: 0))

            path.addQuadCurve(to: CGPoint(x: width, y: cornerRadius), control: CGPoint(x: width-cornerRadius, y: cornerRadius))
            //
            path.addLine(to: CGPoint(x: width, y: height-cornerRadius))
            path.addQuadCurve(to: CGPoint(x: width-cornerRadius, y: height), control: CGPoint(x: width-cornerRadius, y: height-cornerRadius))
            //
            path.addLine(to: CGPoint(x: cornerRadius, y: height))
            path.addQuadCurve(to: CGPoint(x: 0, y: height-cornerRadius), control: CGPoint(x: cornerRadius, y: height-cornerRadius))
            //
            path.addLine(to: CGPoint(x: 0, y: cornerRadius))
            path.addQuadCurve(to: CGPoint(x: cornerRadius, y: 0), control: CGPoint(x: cornerRadius, y: cornerRadius))
        }
    }
}
Notice that I have created a single property called cornerRadius that is being set or read from animatableData setter and getter. That is enough for SwiftUI to perform the animation whenever we change the corner radius.
Let’s test it within a simple demo view that periodically animates corners from value 0 to 20 and back.
You can try to change the animation type or its parameters to see how the animation changes.
struct AnimationDemoView: View {
    @State var cornerRadius: CGFloat = 0.0

    var body: some View {
        CoutOutRectangle(cornerRadius: self.cornerRadius)
            .fill(Color.green)
            .onAppear{
                withAnimation (Animation.easeOut(duration: 0.4).repeatForever(autoreverses: true)){
                    self.cornerRadius = 20.0
                }
            }
    }
}
It works!
AnimatablePair
Now, in the case things are more complicated and we need to animate the shape according to two values, we can utilize AnimatablePair<T> type. Here the only obstacle is to define the right getter and setter to pass data between our control properties and values stored in AnimatablePair.
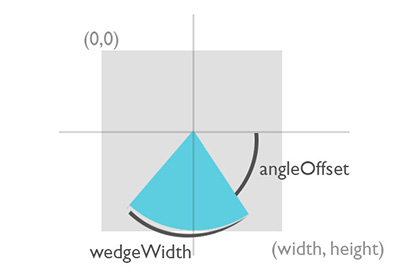
As an example, we will build a wedge shape that can be used to compose pie charts. The wedge has two main properties – angleOffset and wedgeWidth that we both want to be animatable. The best explanation of both properties gives the following illustration:
And the resulting code is here. Note how AnimatablePair`s first and second values are being mapped to our properties.
struct WedgeShape: Shape {
    var angleOffset: Double // in radians
    var wedgeWidth: Double // in radians

    public var animatableData: AnimatablePair<Double, Double> {
        get {
           AnimatablePair(Double(angleOffset), Double(wedgeWidth))
        }

        set {
            self.angleOffset = newValue.first
            self.wedgeWidth = newValue.second
        }
    }

    func path(in rect: CGRect) -> Path {
        return Path { path in
            let width = Double(rect.width)
            let height = Double(rect.height)

            let middlePoint = CGPoint(x: width/2, y: height/2)
            let startingPoint = CGPoint(x: width/2 + cos(self.angleOffset)*width/2, y: height/2 + sin(self.angleOffset)*height/2)
            path.move(to: middlePoint)

            path.addLine(to: startingPoint)
            path.addArc(center: middlePoint, radius: rect.width/2, startAngle: Angle(radians: self.angleOffset), endAngle: Angle(radians: self.angleOffset+self.wedgeWidth), clockwise: false, transform: CGAffineTransform.init(scaleX: 1, y: rect.height/rect.width).translatedBy(x: 0, y: (rect.width-rect.height)/2))

            path.addLine(to: middlePoint)
        }
    }
}
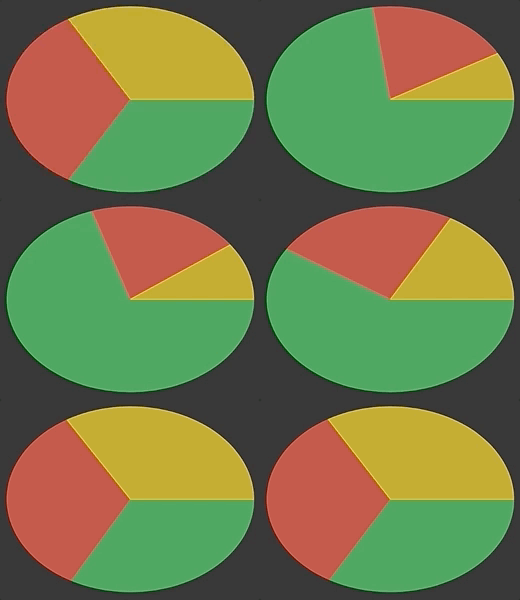
Having wedge shape ready, it is now possible to compose a ZStack of these views to create an animatable pie chart, like this:
AnimatableVector
The obvious question appears. What if our view depends on multiple values and we wish to animate according to all of them? There are two solutions.
First, it is possible to cascade multiple AnimatablePairs to pass more (like 3 or 4) values. Something like this:
AnimatablePair<CGFloat, AnimatablePair<CGFloat, AnimatablePair<CGFloat, CGFloat>>>This is actually used within the implementation of EdgeInsets type, but as you can guess, it is not very flexible and usable for more than five or six values.
Luckily, there is a better approach. As animatableData can be set any type that implements to VectorArithmetic protocol. As we have seen, it is implemented by basic scalar types like Double or CGFloat and of course by AnimatablePair.
Knowing that, let us implement a brand new type called AnimatableVector that will be able to hold up to N values. The VectorArithmetic requires definition of magnitudeSquared property and scale method plus implementation of addition and subtraction operations from AdditiveArithmetic.
Our type is implemented as a standard Euclidean vector: addition, subtraction, and scale of these vectors are being done per-value and the magnitude of the vector is computed as a sum of all squared values. In case you need to refresh this part of high-school math, check this wikipedia article.
The whole implementation of AnimatableVector:
struct AnimatableVector: VectorArithmetic {

    var values: [Double] // vector values

    init(count: Int = 1) {
        self.values = [Double](repeating: 0.0, count: count)
        self.magnitudeSquared = 0.0
    }

    init(with values: [Double]) {
        self.values = values
        self.magnitudeSquared = 0
        self.recomputeMagnitude()
    }

    func computeMagnitude()->Double {
        // compute square magnitued of the vector
        // = sum of all squared values
        var sum: Double = 0.0

        for index in 0..<self.values.count {
            sum += self.values[index]*self.values[index]
        }

        return Double(sum)
    }

    mutating func recomputeMagnitude(){
        self.magnitudeSquared = self.computeMagnitude()
    }

    // MARK: VectorArithmetic
    var magnitudeSquared: Double // squared magnitude of the vector

    mutating func scale(by rhs: Double) {
        // scale vector with a scalar
        // = each value is multiplied by rhs
        for index in 0..<values.count {
            values[index] *= rhs
        }
        self.magnitudeSquared = self.computeMagnitude()
    }

    // MARK: AdditiveArithmetic

    // zero is identity element for aditions
    // = all values are zero
    static var zero: AnimatableVector = AnimatableVector()

    static func + (lhs: AnimatableVector, rhs: AnimatableVector) -> AnimatableVector {
        var retValues = [Double]()

        for index in 0..<min(lhs.values.count, rhs.values.count) {
            retValues.append(lhs.values[index] + rhs.values[index])
        }

        return AnimatableVector(with: retValues)
    }

    static func += (lhs: inout AnimatableVector, rhs: AnimatableVector) {
        for index in 0..<min(lhs.values.count,rhs.values.count)  {
            lhs.values[index] += rhs.values[index]
        }
        lhs.recomputeMagnitude()
    }

    static func - (lhs: AnimatableVector, rhs: AnimatableVector) -> AnimatableVector {
        var retValues = [Double]()

        for index in 0..<min(lhs.values.count, rhs.values.count) {
            retValues.append(lhs.values[index] - rhs.values[index])
        }

        return AnimatableVector(with: retValues)
    }

    static func -= (lhs: inout AnimatableVector, rhs: AnimatableVector) {
        for index in 0..<min(lhs.values.count,rhs.values.count)  {
            lhs.values[index] -= rhs.values[index]
        }
        lhs.recomputeMagnitude()
    }
}
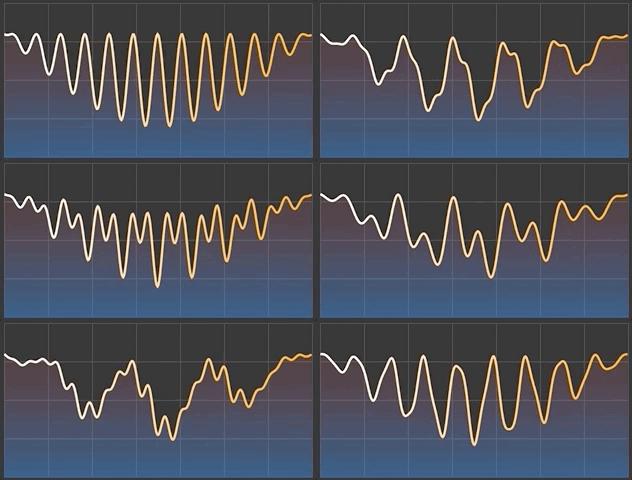
With AnimatableVector you have now complete freedom in building animated shapes and views. One of the handiest use cases is probably the creation of various animated charts, so let me demonstrate it here as well.
I present to you my implementation of AnimatableGraph that plots the values either as a chart line or whole area below it. As you can see, the chart values (here named as controlPoints) are stored and passed as AnimatableVector.
struct AnimatableGraph: Shape {
    var controlPoints: AnimatableVector
    var closedArea: Bool

    var animatableData: AnimatableVector {
        set { self.controlPoints = newValue }
        get { return self.controlPoints }
    }

    func point(index: Int, rect: CGRect) -> CGPoint {
        let value = self.controlPoints.values[index]
        let x = Double(index)/Double(self.controlPoints.values.count)*Double(rect.width)
        let y = Double(rect.height)*value
        return CGPoint(x: x, y: y)
    }

    func path(in rect: CGRect) -> Path {
        return Path { path in

            let startPoint = self.point(index: 0, rect: rect)
            path.move(to: startPoint)

            var i = 1;
            while i < self.controlPoints.values.count {
                path.addLine(to:  self.point(index: i, rect: rect))
                i += 1;
            }

            if (self.closedArea) { // closed area below the chart line
                path.addLine(to: CGPoint(x: rect.width, y: rect.height))
                path.addLine(to: CGPoint(x: 0, y: rect.height))
                path.addLine(to: startPoint)
            }
        }
    }
}
Now, you can style this shape by setting fill and stroke properties and present eye-catching charts that can animate whenever its values are altered:
let areaGradient = LinearGradient(gradient: Gradient(colors: [Color.red.opacity(0.1), Color.blue.opacity(0.4)]), startPoint: UnitPoint(x: 0, y: 0), endPoint: UnitPoint(x: 0, y: 1))
let lineGradient = LinearGradient(gradient: Gradient(colors: [Color.white, Color.orange]), startPoint: UnitPoint(x: 0, y: 0), endPoint: UnitPoint(x: 1, y: 0))


struct DemoChart: View {
    var vector: AnimatableVector

    var body: some View {
        let overlayLine = AnimatableGraph(controlPoints: self.vector, closedArea: false)
            .stroke(lineGradient, lineWidth: 3)
        return  AnimatableGraph(controlPoints: self.vector, closedArea: true)
                    .fill(areaGradient)
                    .overlay(overlayLine)

    }
}
The challenge
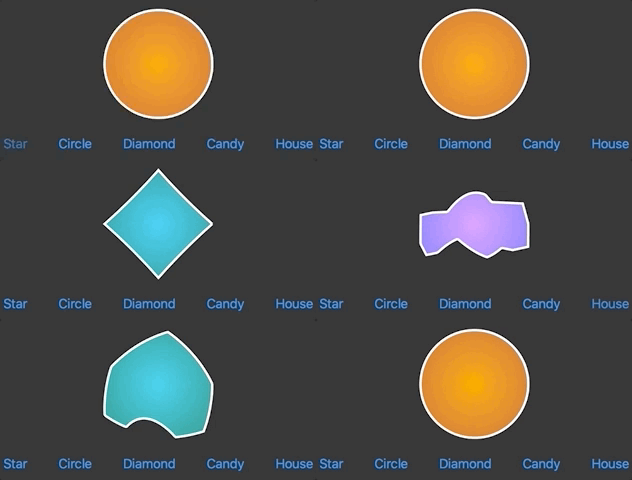
Now try to play with the AnimationVector by yourself and as a challenge implement morphable shapes like this one below:
Do not hesitate to share your solution or ask for help, I will gladly assist you.
I am looking forward to see your output!
Did you enjoy this article? Do you have anything to add?
Feel free to comment or criticize so the next one is even better. Or share it with other SwiftUI adopters 😉
