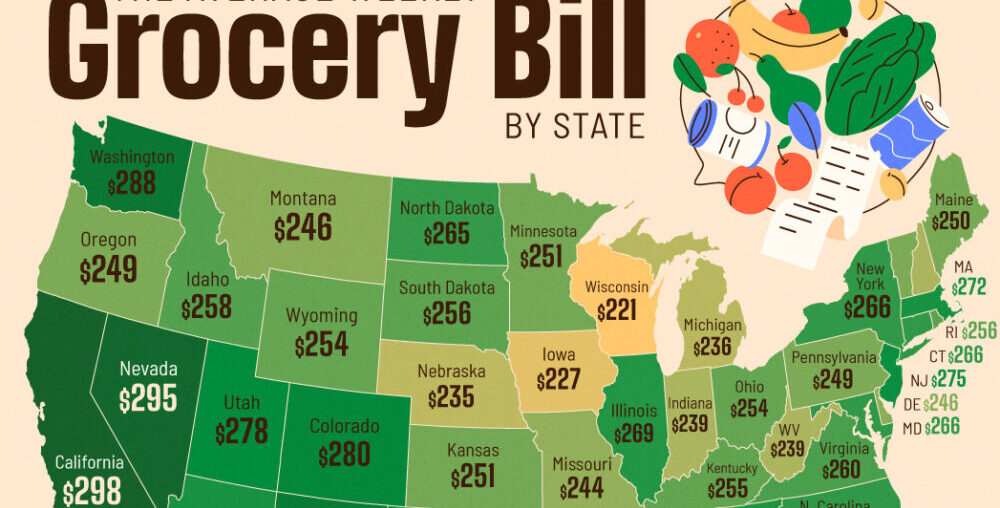
Mapped: How Much Americans Spend on Groceries in Each State
This was originally posted on our Voronoi app. Download the app for free on iOS or Android and discover incredible data-driven charts from a variety of trusted sources.
Since August 2020, prices for “food at home” (groceries) have increased by 20% according to data from the Bureau of Labor Statistics, the steepest inflation seen since the 1970s.
On average, American households are paying about $270 per week ($1,080 a month) for groceries, according to Delish, which sourced their findings from the latest Census Bureau estimates.
But how does this change across the country? From the same source, we map the weekly grocery bill for an American household by each state. Figures are rounded.
Ranked: U.S. States by Weekly Grocery Bills
Hawaii and Alaska, the two non-mainland states, have the highest grocery costs for an average American household: both topping $300 a week, or about $1,200 a month.
Shipping is the primary reason for driving up prices, and neither state produces enough food locally to offset the import costs.
| Rank | State | State Code | Weekly Spend |
|---|---|---|---|
| 1 | Hawaii | HI | $334 |
| 2 | Alaska | AK | $329 |
| 3 | California | CA | $298 |
| 4 | Nevada | NV | $295 |
| 5 | Mississippi | MS | $291 |
| 6 | Washington | WA | $288 |
| 7 | Florida | FL | $287 |
| 8 | New Mexico | NM | $286 |
| 9 | Texas | TX | $286 |
| 10 | Louisiana | LA | $283 |
| 11 | Colorado | CO | $280 |
| 12 | Oklahoma | OK | $279 |
| 13 | Georgia | GA | $278 |
| 14 | Utah | UT | $278 |
| 15 | New Jersey | NJ | $275 |
| 16 | Alabama | AL | $272 |
| 17 | Arizona | AZ | $272 |
| 18 | Massachusetts | MA | $272 |
| 19 | Tennessee | TN | $270 |
| 20 | Illinois | IL | $269 |
| 21 | Connecticut | CT | $266 |
| 22 | Maryland | MD | $266 |
| 23 | New York | NY | $266 |
| 24 | North Carolina | NC | $266 |
| 25 | North Dakota | ND | $265 |
| 26 | Arkansas | AR | $261 |
| 27 | Virginia | VA | $260 |
| 28 | Idaho | ID | $258 |
| 29 | Rhode Island | RI | $256 |
| 30 | South Dakota | SD | $256 |
| 31 | Kentucky | KY | $255 |
| 32 | Washington, D.C. | DC | $255 |
| 33 | Ohio | OH | $254 |
| 34 | South Carolina | SC | $254 |
| 35 | Wyoming | WY | $254 |
| 36 | Kansas | KS | $251 |
| 37 | Minnesota | MN | $251 |
| 38 | Maine | ME | $250 |
| 39 | Oregon | OR | $249 |
| 40 | Pennsylvania | PA | $249 |
| 41 | Vermont | VT | $249 |
| 42 | Delaware | DE | $246 |
| 43 | Montana | MT | $246 |
| 44 | Missouri | MO | $244 |
| 45 | Indiana | IN | $239 |
| 46 | New Hampshire | NH | $239 |
| 47 | West Virginia | WV | $239 |
| 48 | Michigan | MI | $236 |
| 49 | Nebraska | NE | $235 |
| 50 | Iowa | IA | $227 |
| 51 | Wisconsin | WI | $221 |
| N/A | National Average | $270 |
For what it’s worth, Alaskans pay very low taxes (no income, nor inheritance tax, and a very low sales tax) so the higher grocery bill may be far more affordable than other states with lower bills.
Meanwhile, the Midwest has some of the lowest grocery costs across the country. These state economies are often tied to farming and food production, helping keep grocery prices down.
There is some correlation between places (like California, Washington, and New York) with higher grocery prices, and, well, higher prices generally—where $100 doesn’t go as far as it does in the rest of the country.
However, in Mississippi, New Mexico, and Arizona—where living costs are lower—food prices remain in the top half of the ranking. This indicates a greater financial strain for food despite lower overall living expenses.
Learn More on the Voronoi App 
Eating out hasn’t been spared inflation’s effect either. Check out Charted: Inflation Across U.S. Fast Food Chains (2014-2024) to see how the occasional McDonald’s cheat meal is taking more out of your pocket.

