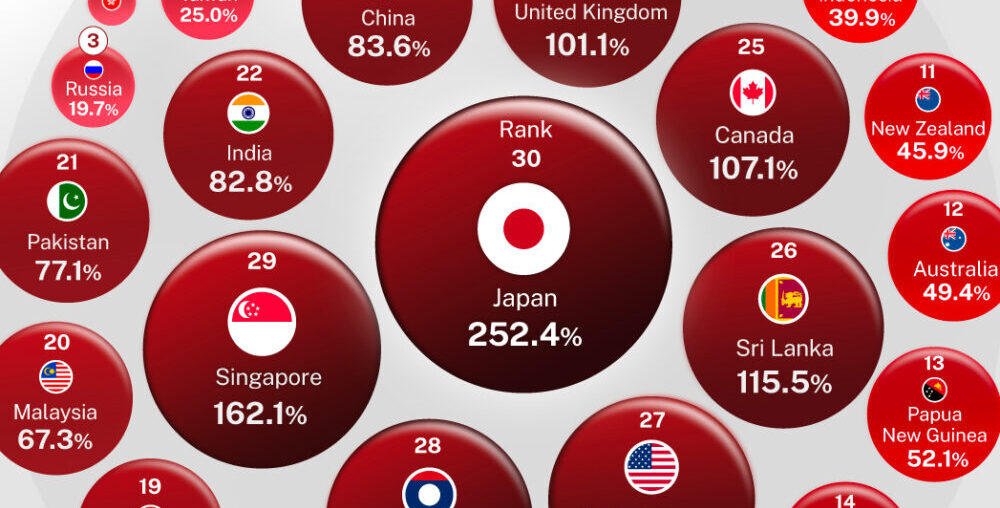
Ranked: Government Debt Across Major Economies
The government debt-to-GDP ratio is a key indicator of a country’s financial health. It provides insight into the government’s capacity to manage its debt, shapes fiscal policy flexibility, and plays a crucial role in influencing investor confidence.
This graphic, created in partnership with the Hinrich Foundation, shows public debt as a percentage of GDP across 30 major economies. Data is from the IMF’s World Economic Outlook.
The analysis comes from the 2024 Sustainable Trade Index (STI), which the Hinrich Foundation produced in collaboration with the IMD World Competitiveness Center.
Data Overview
To create the STI’s public debt metric, government debt-to-GDP ratios from the IMF were converted into a numerical index score. The scores were then averaged for each economy, creating a range of 0 to 100.
| Rank | Economy | Government debt-to-GDP (%) |
|---|---|---|
| 1 | 🇧🇳 Brunei | 2.3 |
| 2 | 🇭🇰 Hong Kong | 6.5 |
| 3 | 🇷🇺 Russia | 19.7 |
| 4 | 🇹🇼 Taiwan | 25.0 |
| 5 | 🇰🇭 Cambodia | 25.9 |
| 6 | 🇵🇪 Peru | 32.1 |
| 7 | 🇻🇳 Vietnam | 34.0 |
| 8 | 🇨🇱 Chile | 39.4 |
| 9 | 🇧🇩 Bangladesh | 39.8 |
| 10 | 🇮🇩 Indonesia | 39.9 |
| 11 | 🇳🇿 New Zealand | 45.9 |
| 12 | 🇦🇺 Australia | 49.4 |
| 13 | 🇵🇬 Papua New Guinea | 52.1 |
| 14 | 🇲🇽 Mexico | 53.1 |
| 15 | 🇪🇨 Ecuador | 54.7 |
| 16 | 🇰🇷 South Korea | 55.2 |
| 17 | 🇵🇭 Philippines | 56.6 |
| 18 | 🇲🇲 Myanmar | 59.3 |
| 19 | 🇹🇭 Thailand | 62.4 |
| 20 | 🇲🇾 Malaysia | 67.3 |
| 21 | 🇵🇰 Pakistan | 77.1 |
| 22 | 🇮🇳 India | 82.8 |
| 23 | 🇨🇳 China | 83.6 |
| 24 | 🇬🇧 United Kingdom | 101.1 |
| 25 | 🇨🇦 Canada | 107.1 |
| 26 | 🇱🇰 Sri Lanka | 115.5 |
| 27 | 🇺🇸 United States | 122.2 |
| 28 | 🇱🇦 Laos | 122.8 |
| 29 | 🇸🇬 Singapore | 162.1 |
| 30 | 🇯🇵 Japan | 252.4 |
A relatively low ratio of public debt-to-GDP, such as for Brunei, translated into a high (and favorable) STI government debt score. Conversely, a relatively high public debt ratio, such as for Japan, translated into a low (and thus unfavorable) STI government debt score.
Public debt ratios can provide important context to understand a country’s ability to meet its financial obligations. A high ratio can also affect investor confidence, undermine economic stability, and constrict economic growth. Furthermore, fiscal policy options may be constrained.
It’s also important to note that high-level debt ratios can mask important dynamics that lie beneath the surface. For example, China’s federal government debt score is quite favorable. However, the country’s elevated levels of local debt—which are not captured in this metric—undercut its financial stability.
Explore the Sustainable Trade Index
This infographic was just a small subset of what the Sustainable Trade Index has to offer. To learn more, visit the Hinrich Foundation, where you can download additional resources including the entire report for free.


