Google Sheets is great for analyzing data, but sometimes you need to include charts in a Google Docs document. Luckily, there are easy ways to import charts from Google Sheets.
How to Import a Google Sheets Chart Into Google Docs
Using Google Sheets as your data source comes with a significant benefit—the ability to update charts across multiple documents easily. By linking your charts to a single spreadsheet, any changes you make to the data can be reflected in all linked charts, saving you time and effort.
Importing charts from Google Sheets into your Google Docs is a straightforward process. You can either copy the chart directly from the spreadsheet or use the built-in Import feature in Google Docs.
Import a Chart by Copying from Google Sheets
To add a chart from Google Sheets to your Google Docs document by copying it, follow these steps.
- Open the Google Sheets spreadsheet containing the chart you want to import.
- Click on the chart to select it. If the chart is in edit mode, you may need to double-click.
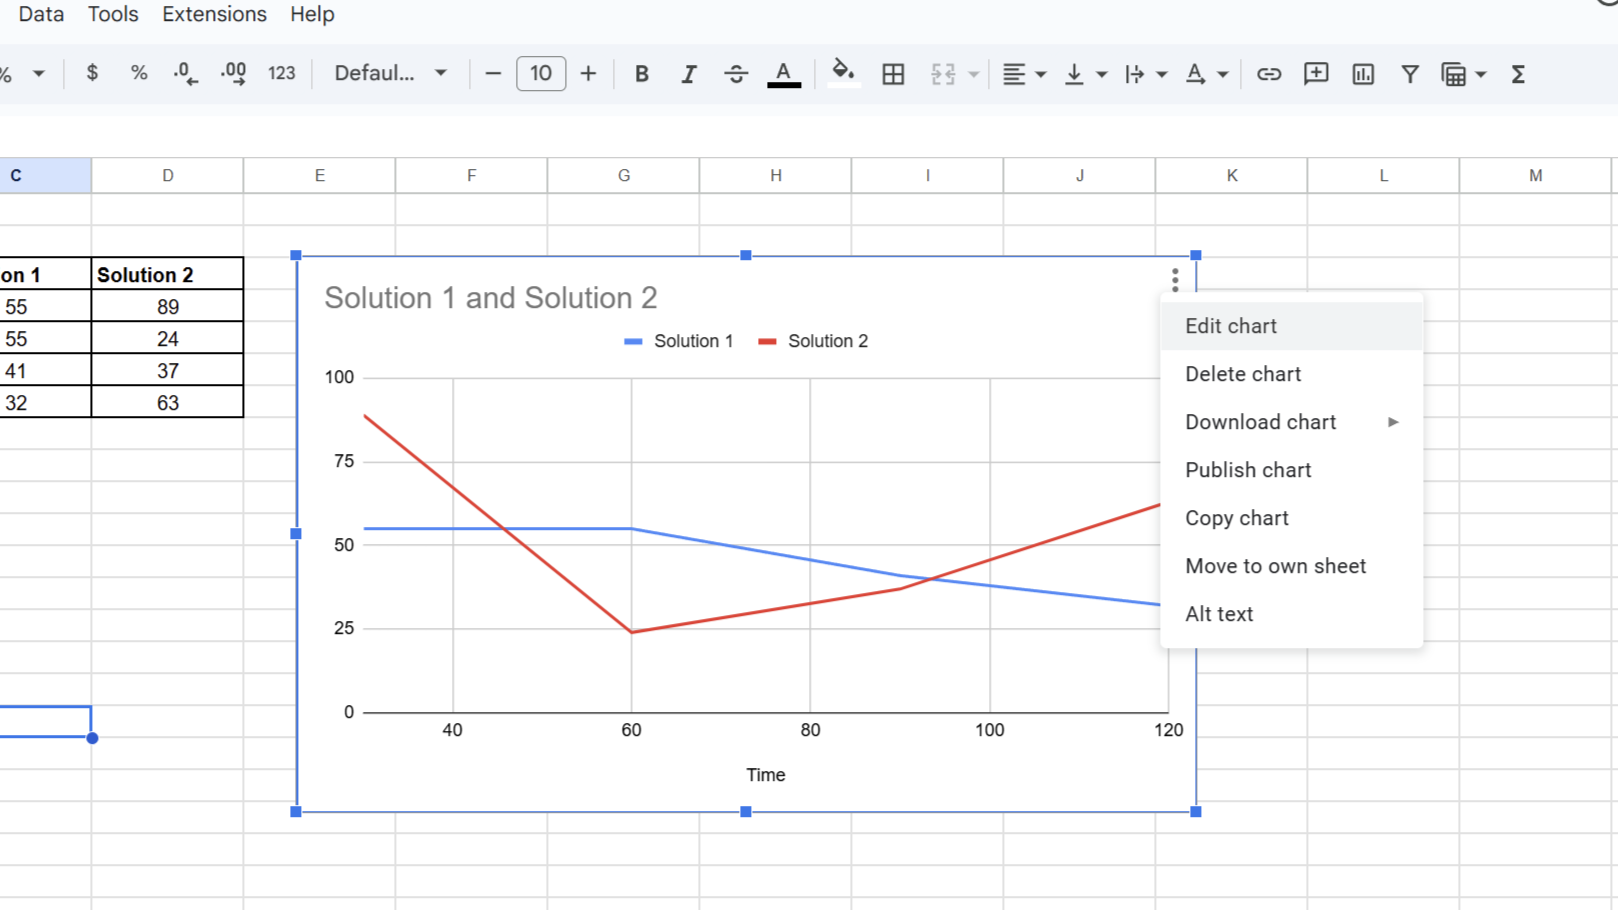
- Use the three-dot menu in the upper-right corner of the chart and select Copy chart.
- Navigate to your Google Docs document where you want to insert the chart.
- Click where you want to place the chart and press Ctrl+V (Windows) or Cmd+V (Mac) to paste the chart.
- A dialog box will appear asking if you want to link the chart to the spreadsheet. Linking allows for updates in the document when the source data changes.
Insert a Chart Directly from Google Sheets
You can also use the following alternative method to insert charts from Google Sheets into your Google Docs document.
- Open your Google Docs document where you want to insert the chart.
- Go to the Insert menu in the toolbar and hover over the Chart.
- In the sub-menu that appears, click From Sheets.
- A new window will open, displaying your Google Sheets spreadsheets. Select the spreadsheet containing the chart you want to insert.
- Select the desired chart from the list of available charts and click Import.
This method is convenient when you want to insert a chart without leaving your Google Docs document.
Updating and Synchronizing the Chart
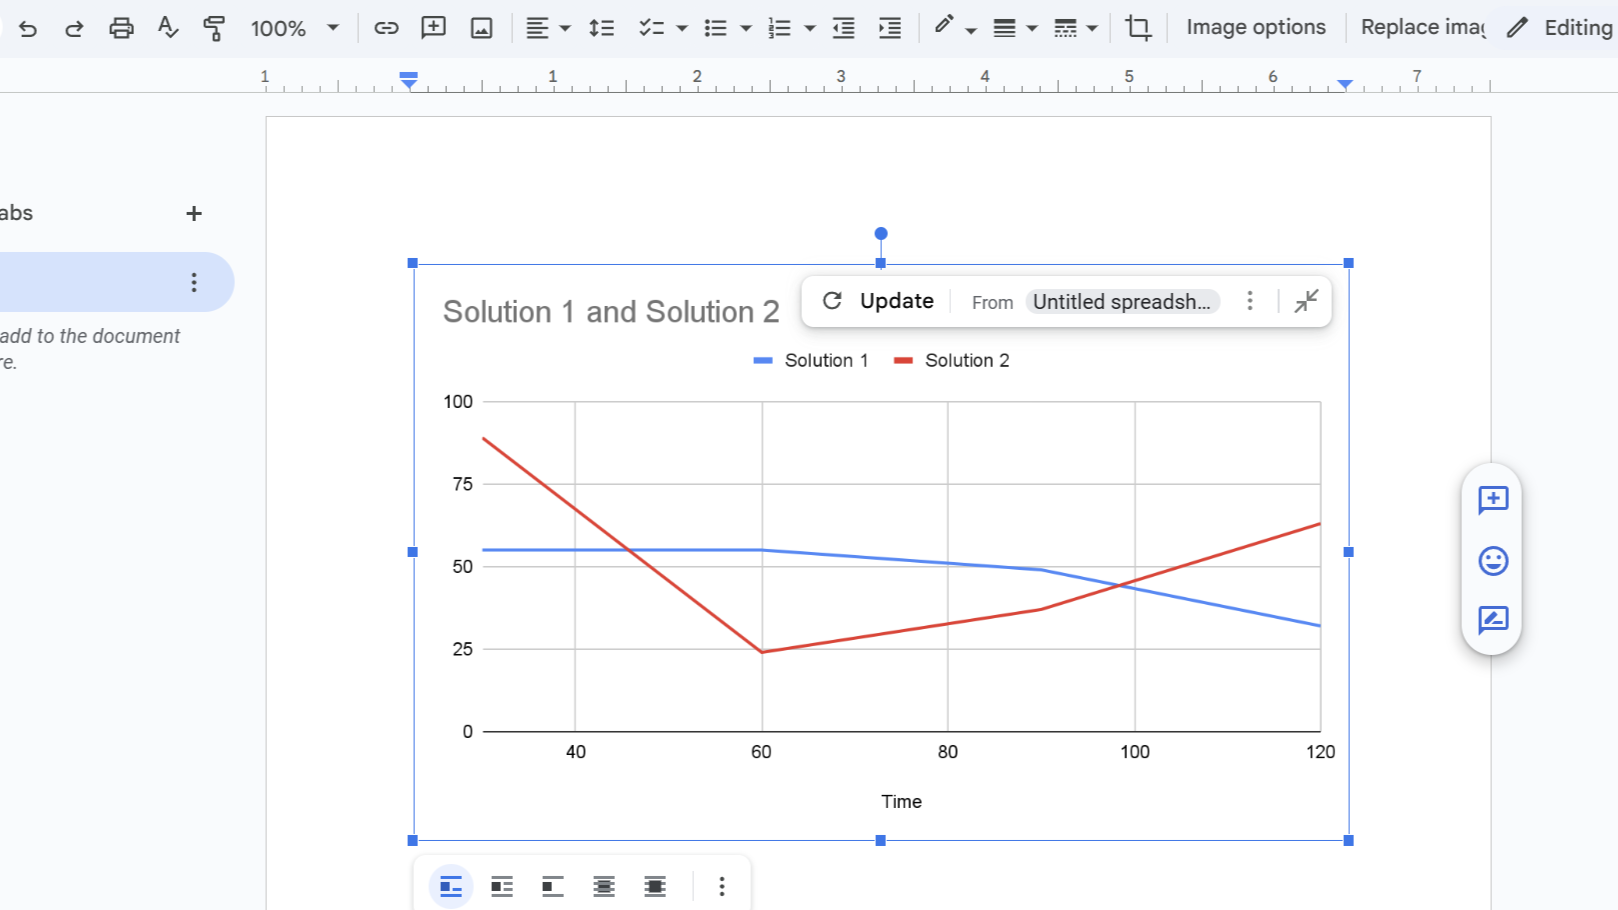
When you import a chart from Google Sheets into your Google Docs document, you have the option to link it to the source spreadsheet. This allows the chart to be updated whenever changes are made to the data in the linked spreadsheet.
To update a linked chart, click on it and select Update from the menu that appears. But if you want to unlink the chart from its source data, click on the three dots and select Unlink instead.
Customizing the Imported Chart in Google Docs
Once you’ve imported a chart from Google Sheets into your Google Docs document, you may want to customize its appearance to better fit your document’s style and layout. While there are basic options to edit images in Google Docs, most of the changes need to be made to the original Google Sheets spreadsheet.
To resize the chart within your document, simply click on it and drag the handles that appear on the corners. This allows you to make the chart larger or smaller to suit your needs without affecting the chart’s proportions or data.
If you want to try other different chart types—for example, from a bar chart to a line chart—you’ll need to make this change in the original Google Sheets spreadsheet. Open the spreadsheet, click the chart > three dots > Edit chart and use the Chart editor sidebar to modify the chart type and other settings.
In Google Sheets, you can edit the chart title and add an axis and legend to better describe your data. However, keep in mind that these customizations will only affect the chart in the spreadsheet. You’ll need to manually update the linked chart as described earlier to see these changes reflected in your Google Docs document.


