Visualizing the Ethereum to Bitcoin Ratio (2015-2024)
This was originally posted on our Voronoi app. Download the app for free on iOS or Android and discover incredible data-driven charts from a variety of trusted sources.
The value of ethereum compared to bitcoin recently hit a three-year low, but a reversal could be on the horizon following Trump’s election victory.
The second-largest cryptocurrency by market cap behind bitcoin, ethereum has historically followed bitcoin’s price movements against the U.S. dollar with more volatility.
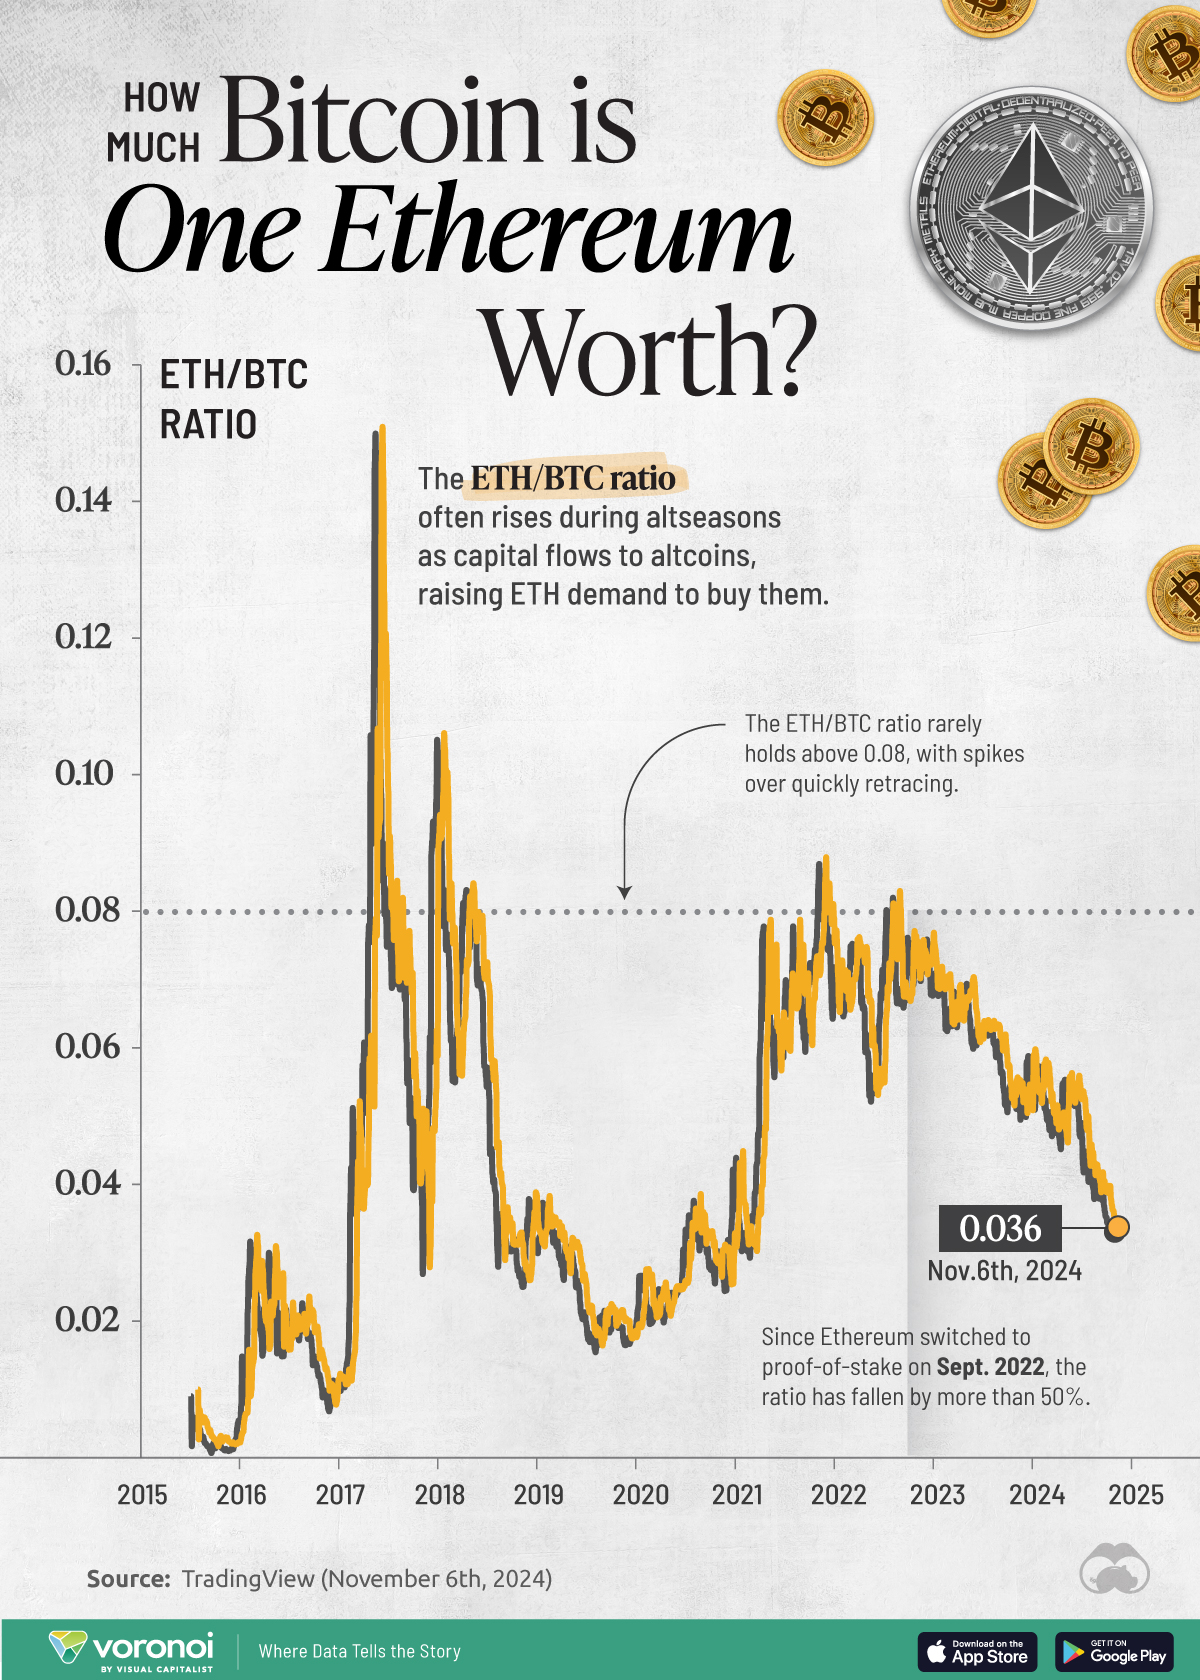
This graphic uses data from TradingView to show the ETH/BTC ratio, a key barometer of the cryptocurrency market’s interest and demand for altcoins (alternative cryptocurrencies besides bitcoin and ethereum), which can be purchased using ETH on the Ethereum blockchain.
How Has the ETH/BTC Ratio Changed Over Time?
Today, the second-largest cryptocurrency has returned 32% year-to-date against the U.S. dollar while bitcoin has climbed 83% to reach about $77,000 as of November 8th.
Overall, the ETH/BTC ratio has declined sharply since its highs in September 2022, when the Ethereum blockchain updated to a proof-of-stake network to improve security and energy efficiency.
While investor optimism leading up to this event pushed ethereum’s prices higher, interest waned after the event. This coincided with a broader crypto winter in 2022, with investors turning to bitcoin or other safer assets.
| Date | Ethereum / Bitcoin Ratio |
|---|---|
| Nov 5 2024 | 0.035 |
| Oct 2024 | 0.039 |
| Sep 2024 | 0.042 |
| Aug 2024 | 0.048 |
| Jul 2024 | 0.054 |
| Jun 2024 | 0.054 |
| May 2024 | 0.049 |
| Apr 2024 | 0.049 |
| Mar 2024 | 0.055 |
| Feb 2024 | 0.054 |
| Jan 2024 | 0.052 |
| Dec 2023 | 0.052 |
| Nov 2023 | 0.054 |
| Oct 2023 | 0.060 |
| Sep 2023 | 0.063 |
| Aug 2023 | 0.063 |
| Jul 2023 | 0.063 |
| Jun 2023 | 0.070 |
| May 2023 | 0.066 |
| Apr 2023 | 0.065 |
| Mar 2023 | 0.070 |
| Feb 2023 | 0.071 |
| Jan 2023 | 0.073 |
| Dec 2022 | 0.074 |
| Nov 2022 | 0.076 |
| Oct 2022 | 0.067 |
| Sep 2022 | 0.079 |
| Aug 2022 | 0.071 |
| Jul 2022 | 0.056 |
| Jun 2022 | 0.060 |
| May 2022 | 0.074 |
| Apr 2022 | 0.076 |
| Feb 2022 | 0.073 |
| Jan 2022 | 0.081 |
| Dec 2021 | 0.085 |
| Nov 2021 | 0.073 |
| Oct 2021 | 0.071 |
| Sep 2021 | 0.079 |
| Aug 2021 | 0.069 |
| Jul 2021 | 0.065 |
| Jun 2021 | 0.074 |
| May 2021 | 0.060 |
| Apr 2021 | 0.035 |
| Mar 2021 | 0.032 |
| Feb 2021 | 0.045 |
| Jan 2021 | 0.030 |
| Dec 2020 | 0.030 |
| Nov 2020 | 0.028 |
| Oct 2020 | 0.033 |
| Sep 2020 | 0.033 |
| Aug 2020 | 0.034 |
| Jul 2020 | 0.025 |
| Jun 2020 | 0.025 |
| May 2020 | 0.023 |
| Apr 2020 | 0.021 |
| Mar 2020 | 0.026 |
| Feb 2020 | 0.021 |
| Jan 2020 | 0.018 |
| Dec 2019 | 0.020 |
| Nov 2019 | 0.020 |
| Oct 2019 | 0.021 |
| Sep 2019 | 0.017 |
| Aug 2019 | 0.020 |
| Jul 2019 | 0.026 |
| Jun 2019 | 0.032 |
| May 2019 | 0.029 |
| Apr 2019 | 0.032 |
| Mar 2019 | 0.034 |
| Feb 2019 | 0.031 |
| Jan 2019 | 0.039 |
| Dec 2018 | 0.027 |
| Nov 2018 | 0.033 |
| Oct 2018 | 0.034 |
| Sep 2018 | 0.040 |
| Aug 2018 | 0.058 |
| Jul 2018 | 0.072 |
| Jun 2018 | 0.080 |
| May 2018 | 0.080 |
| Apr 2018 | 0.056 |
| Mar 2018 | 0.075 |
| Feb 2018 | 0.101 |
| Jan 2018 | 0.063 |
| Dec 2017 | 0.039 |
| Nov 2017 | 0.040 |
| Oct 2017 | 0.068 |
| Sep 2017 | 0.076 |
| Aug 2017 | 0.076 |
| Jul 2017 | 0.104 |
| Jun 2017 | 0.093 |
| May 2017 | 0.054 |
| Apr 2017 | 0.039 |
| Mar 2017 | 0.015 |
| Feb 2017 | 0.011 |
| Jan 2017 | 0.009 |
| Dec 2016 | 0.010 |
| Nov 2016 | 0.016 |
| Oct 2016 | 0.021 |
| Sep 2016 | 0.019 |
| Aug 2016 | 0.018 |
| Jul 2016 | 0.017 |
| Jun 2016 | 0.024 |
| May 2016 | 0.022 |
| Apr 2016 | 0.025 |
| Mar 2016 | 0.023 |
| Feb 2016 | 0.007 |
| Jan 2016 | 0.002 |
| Dec 2015 | 0.002 |
| Nov 2015 | 0.002 |
| Oct 2015 | 0.003 |
| Sep 2015 | 0.006 |
| Aug 2015 | 0.010 |
The last time the ETH/BTC ratio dropped this low, ethereum rallied 120% in the next two months. While institutional investors have largely focused on bitcoin, ethereum has attracted comparatively less interest, despite its pivotal role in decentralized finance.
What Drives Ethereum’s Price and Volatility?
Driving ethereum’s significant price gains against bitcoin is the increasing emergence of initial coin offerings and decentralized applications (DApps) that are run on the Ethereum blockchain
In 2021, the ETH/BTC climbed to 0.87 as interest in DApps gained renewed momentum. By the end of 2021, there were 2.7 million unique active wallets connected to DApps, and across the wider decentralized finance space, 60% were run on the Ethereum blockchain.
Fast-forward to today, bitcoin still dominates the crypto landscape. bitcoin ETF assets stand at roughly $70 billion, more than doubling over the past year. In contrast, ethereum ETF assets under management have fallen from nearly $10 billion to $7 billion as of early November. However, since November 6, ETF inflows have surged by $132 million in two days, signaling bullish sentiment among investors.
Learn More on the Voronoi App 
To learn more about this topic from an ownership perspective, check out this graphic on the largest corporate holders of bitcoin.


