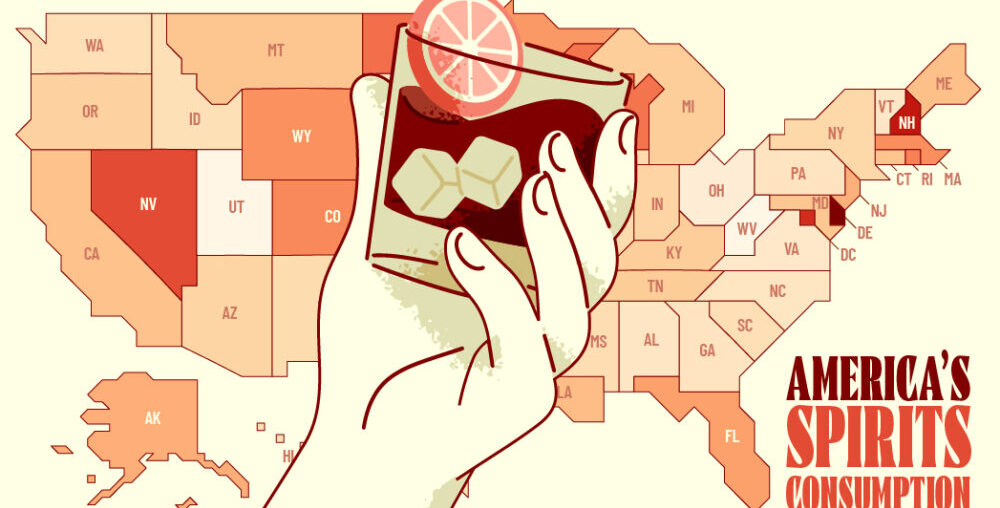
Spirits Consumption by U.S. State
This was originally posted on our Voronoi app. Download the app for free on iOS or Android and discover incredible data-driven charts from a variety of trusted sources.
From whiskey to vodka to tequila, spirits are enjoyed by a range of drinkers in cocktails, on the rocks, or simply as straight shots. North America’s spirits market size is expected to see steady growth in the next few years, with the rise of spirit-based canned drinks and growing popularity of cocktail culture.
This map visualizes annual per capita ethanol consumption of spirits in gallons in 2022, by state.
The data comes from the National Institute on Alcohol Abuse and Alcoholism (NIAAA), which measures alcohol consumption in ethanol volume.
For reference, the average 750 mL bottle of spirits (41.1% ABV) contains 0.0814 gallons of ethanol.
Consumption figures only include residents aged 14 or older, and are based on alcoholic beverage sales data collected by the Alcohol Epidemiologic Data System (AEDS), the National Alcohol Beverage Control Association, and various reports produced by beverage industry sources.
Which States Consume the Most Spirits?
Below, we show each state’s annual per capita ethanol consumption of spirits in gallons in 2022.
| State | Per capita ethanol consumption in gallons of spirits |
|---|---|
| Delaware | 2.34 |
| New Hampshire | 2.02 |
| District of Columbia | 1.92 |
| Nevada | 1.78 |
| North Dakota | 1.62 |
| Wisconsin | 1.59 |
| Rhode Island | 1.53 |
| Colorado | 1.48 |
| Massachusetts | 1.45 |
| Wyoming | 1.44 |
| Minnesota | 1.4 |
| Florida | 1.36 |
| Missouri | 1.35 |
| Alaska | 1.29 |
| New Jersey | 1.28 |
| Louisiana | 1.2 |
| Maine | 1.18 |
| California | 1.16 |
| Connecticut | 1.15 |
| Montana | 1.14 |
| Maryland | 1.12 |
| Tennessee | 1.07 |
| Kentucky | 1.06 |
| Michigan | 1.06 |
| Oregon | 1.02 |
| Indiana | 1 |
| Arizona | 0.99 |
| Iowa | 0.99 |
| Kansas | 0.99 |
| New York | 0.96 |
| Illinois | 0.93 |
| New Mexico | 0.92 |
| Mississippi | 0.91 |
| South Carolina | 0.89 |
| Washington | 0.89 |
| Hawaii | 0.88 |
| Idaho | 0.88 |
| Texas | 0.88 |
| Nebraska | 0.86 |
| Georgia | 0.83 |
| Pennsylvania | 0.83 |
| North Carolina | 0.82 |
| Alabama | 0.81 |
| South Dakota | 0.81 |
| Vermont | 0.8 |
| Arkansas | 0.79 |
| Virginia | 0.78 |
| Oklahoma | 0.76 |
| Ohio | 0.71 |
| Utah | 0.57 |
| West Virginia | 0.57 |
The average annual per capita ethanol consumption from spirits in the U.S. is 1.06 gallons, which is equivalent to about 13 bottles of spirits.
In 2022, Delaware residents had the highest per capita spirit consumption in the U.S., with an annual average of 2.34 gallons of ethanol from spirits, or 28.7 bottles of spirits.
According to Delaware Health and Social Services, 14% of Delaware adults reported binge drinking, and 5.5% reported chronic, heavy drinking.
New Hampshire’s lack of state sales tax makes alcohol, including spirits, significantly cheaper than in neighboring states, which likely drives higher spirit purchases and consumption as residents from nearby areas cross state lines to take advantage of the lower prices.
New Hampshire ranked second in per capita spirit purchases, with an average ethanol consumption of 2.02 gallons from spirits. It also ranked first in the nation for per capita beer consumption.
Learn More on the Voronoi App 
To learn more about alcohol consumption in the U.S., check out this graphic that shows beer consumption by U.S. state.

