Mapped: U.S. Median Income in Blue, Red, and Swing States
This was originally posted on our Voronoi app. Download the app for free on iOS or Android and discover incredible data-driven charts from a variety of trusted sources.
The 2024 U.S. presidential election will be determined by over 186 million voters, but the outcome will likely hinge on a small group in a few key swing states.
Of the 50 states, only seven are truly competitive, with the rest strongly favoring either Democrats or Republicans.
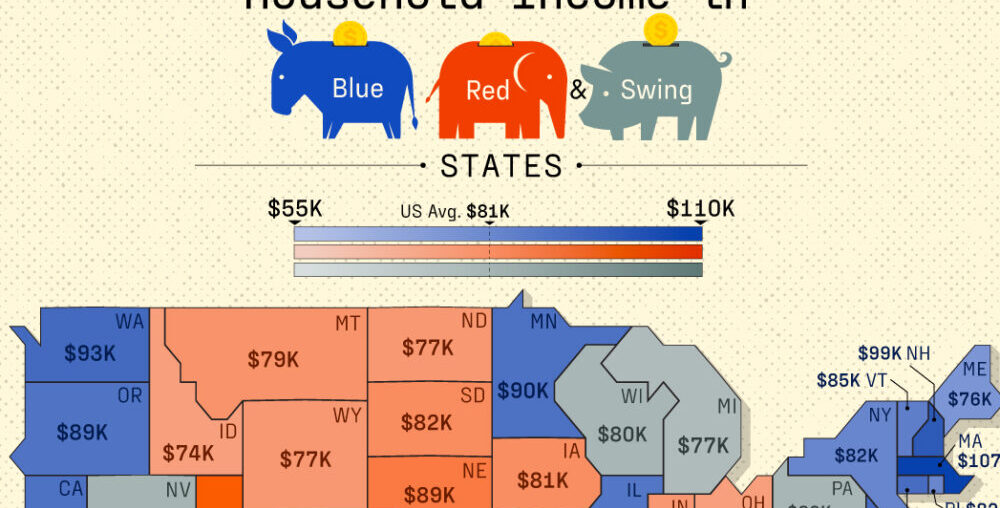
This graphic shows the median household income (2023) by state, categorized into blue (Democratic), red (Republican), and the seven swing states. Data is sourced from the Federal Reserve Bank of St. Louis and various media outlets.
Blue States Generally Have Higher Incomes
Blue states generally have higher household incomes, driven by urbanized, diversified, and service-oriented economies. Many blue states exceed the national median of $81,000, with states like Massachusetts and Maryland reporting average incomes over $100,000 per year.
| Blue States (Democratic) | Household Income (K) | Political Leanings |
|---|---|---|
| Massachusetts | 107K | Blue State |
| Maryland | 102K | Blue State |
| Utah | 101K | Red State |
| New Hampshire | 99K | Blue State |
| Alaska | 98K | Red State |
| Colorado | 97K | Blue State |
| Hawaii | 97K | Blue State |
| Virginia | 96K | Blue State |
| Washington | 93K | Blue State |
| Connecticut | 92K | Blue State |
| New Jersey | 92K | Blue State |
| California | 90K | Blue State |
| Minnesota | 90K | Blue State |
| Oregon | 89K | Blue State |
| Nebraska | 89K | Red State |
| Illinois | 88K | Blue State |
| Delaware | 86K | Blue State |
| Vermont | 85K | Blue State |
| Kansas | 85K | Red State |
| Arizona | 83K | Swing State |
| New York | 82K | Blue State |
| Rhode Island | 82K | Blue State |
| South Dakota | 82K | Red State |
| Iowa | 81K | Red State |
| Nevada | 81K | Swing State |
| Pennsylvania | 80K | Swing State |
| Wisconsin | 80K | Swing State |
| Montana | 79K | Red State |
| Texas | 79K | Red State |
| Missouri | 78K | Red State |
| Indiana | 77K | Red State |
| North Dakota | 77K | Red State |
| Wyoming | 77K | Red State |
| Michigan | 77K | Swing State |
| Maine | 76K | Blue State |
| Idaho | 74K | Red State |
| Ohio | 74K | Red State |
| Tennessee | 73K | Red State |
| Florida | 72K | Red State |
| Georgia | 72K | Swing State |
| South Carolina | 69K | Red State |
| North Carolina | 69K | Swing State |
| Oklahoma | 67K | Red State |
| Arkansas | 63K | Red State |
| Kentucky | 62K | Red State |
| New Mexico | 61K | Blue State |
| Alabama | 61K | Red State |
| West Virginia | 60K | Red State |
| Louisiana | 58K | Red State |
| Mississippi | 55K | Red State |
| U.S. Average | 81K |
In contrast, red states tend to have lower incomes, with economies relying more on agriculture, manufacturing, and natural resources. Several of these states fall below the national average, with Mississippi ($55,000) and Louisiana ($58,000) under $60,000.
However, exceptions exist on both sides. New Mexico, a blue state, has a lower income of $61,000, while Alaska ($98,000) and Utah ($101,000), both red states, have median incomes higher than the national average.
Learn More on the Voronoi App 
To learn more about this topic from the perspective of election contributions, check out this graphic on the top companies by PAC donations in 2024.
Get the Visual Guide to the Election 2024
We’ve published an eBook that covers the key issues facing Americans in the lead-up to the 2024 U.S. Presidential election.
This exclusive visual guide is packed full of charts and it’s free to VC+ members.
What else do you get as a VC+ Member?
If you enjoy Visual Capitalist’s regular work, you’ll love VC+, our premium subscription. As a member, you’ll get exclusive access to:
- Special Dispatches: Deep dive visual briefings on crucial reports and global trends
- Markets This Month: A snappy summary of the state of the markets
- The Trendline: Weekly curation of the best visualizations from across the globe, handpicked by the Visual Capitalist editorial team
- Global Forecast Series: Our flagship annual report that covers everything you need to know related to the economy, markets, geopolitics, and the latest tech trends
- VC+ Archive: Hundreds of previously released VC+ briefings and reports that you’ve been missing out on, all in one dedicated hub
- Visual Capitalist Ad-Free: Complimentary Ad-Free access to www.visualcapitalist.com (worth $23.99/year)


