Stripe replaced its observability platform, which used a third-party vendor solution, with a new architecture utilizing managed services on AWS. The company made the move due to scalability limits, reliability issues, and increasing costs while transitioning to microservices. The migration involved dual-writing metrics, translating assets, validation, and user training.
After adopting microservices, Stripe’s architecture generated around 300 million metrics, 40,000 alerts, and 100,000 dashboard queries generated by seven thousand employees. With such a large footprint, the preexisting observability platform started to struggle, resulting in scalability and reliability issues and increasing costs.
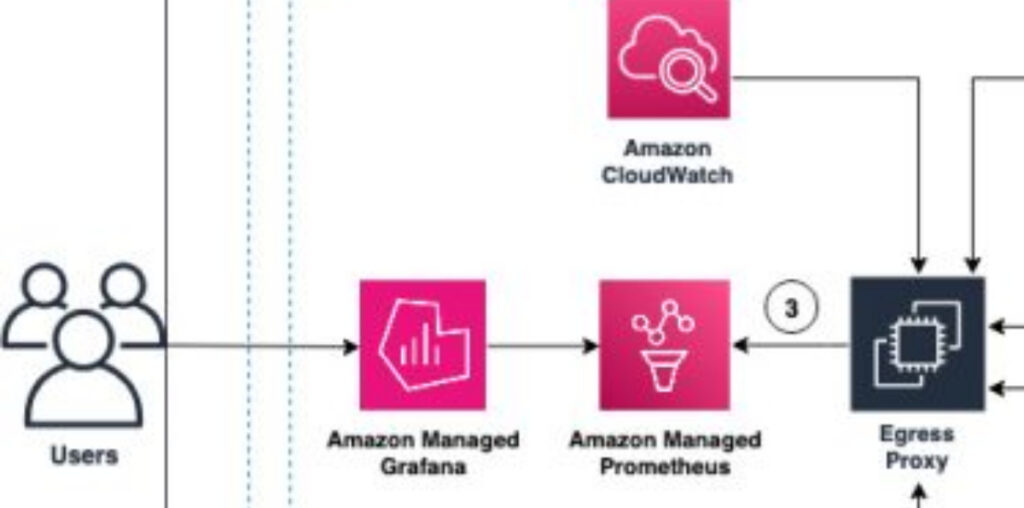
The company decided to adopt a solution that would offer higher capacity and higher cost efficiency and chose to use Amazon managed service for Prometheus (AMP) and Grafana. The transitional architecture of the observability platform for metrics consisted of several components. Metric collected from compute hosts and scraped from Kubernetes clusters were delivered to the aggregation layer. Metrics from the aggregation layer and Amazon CloudWatch were ingested into Amazon Managed Prometheus by the Egress Proxy. Additionally, aggregated and unaggregated metrics were sent to the legacy time-series database to support the migration.

Transitional Architecture for Metrics Storage, Aggregation, and Serving (Source: AWS Blog)
Stripe, working with AWS, divided the migration process into four phases. The migration started by enabling the dual writing of metrics into legacy and new storage solutions, which was supported by creating a comprehensive suite of unit tests for validating the data flows.
The second phase involved translating the assets (alerts and dashboards). Engineers created a solution for automating conversion from the legacy asset definitions to target ones using PromQL, AlertManager, and Grafana formats. Additionally, the company has promoted the adoption of template modules for alert definitions to improve monitoring coverage and consistency.
The next stage of the process focused on validating the new architecture. Engineers used promtool to create automated unit tests and reverted to human reviews for unique alerts. The migration team also discovered some incorrect alerts in their legacy solution and developed heuristics for resolving such issues, falling back to human reviews if necessary. Additionally, Stripe leveraged the abstract syntax tree (AST) to categorize alert expressions for 70% of alerts that didn’t have historical data during the dual-write period.
The last phase focused on adopting the new solution among the engineering user base. Cody Rioux and Michael Cowgill, staff engineers at Stripe, shared insights about transitioning between observability solutions and the impact on engineering teams:
While validation is the most impactful workstream, migrating the mental models of Stripe’s user base was among the most influential on how the migration is perceived across the company. When making a choice about methods, there is a trade-off between scalable and personable methods. Scalable methods will save Observability team’s sanity, whereas personable methods will save users’ sanity, so both need to be employed.
The team has highlighted key lessons learned during the rollout, including the need to engage the technical writing and developer education communities in the migration process, avoiding the trap of rushing the migration and rollout to engineering teams for the sake of hitting metrics and focusing on personalized education methods to create local experts that can bring multiplying effect in educating a broader use base.

