How fast your Linux computer can move data between its hard drives and RAM has a direct impact on its performance. These five commands will help you troubleshoot slowdowns and stuttering performance.
Working Hard or Hardly Working? Five Ways to Find Out
From the moment your computer boots and while it’s up and running, it needs to read from, and write to, your hard drives.
Your drives have a maximum data throughput. There’s a limit to the rate they can read and write data at. That means booting, loading programs and utilities, and saving data such as documents, settings, and downloads are all rate-limited by the baked-in limitations of your hard drives.
Modern drives are built to be fast, especially solid state drives, but even the fastest drives can have a backlog of data requests if too many processes are trying to access them at once.
If your PC is running in a laggy fashion with intermittent slowdowns, or has periods when it seems jittery and hesitant, use these five commands to see whether you’ve hit a hard drive bottleneck.
Measuring I/O Statistics with iostat
The iostat command is part of the sysstat package. On the Ubuntu 24.10, the latest Manjaro, and Fedora Linux 40 computers we tested, iostat was already installed. If you don’t have it installed, look for the sysstat package in your distribution’s repositories.
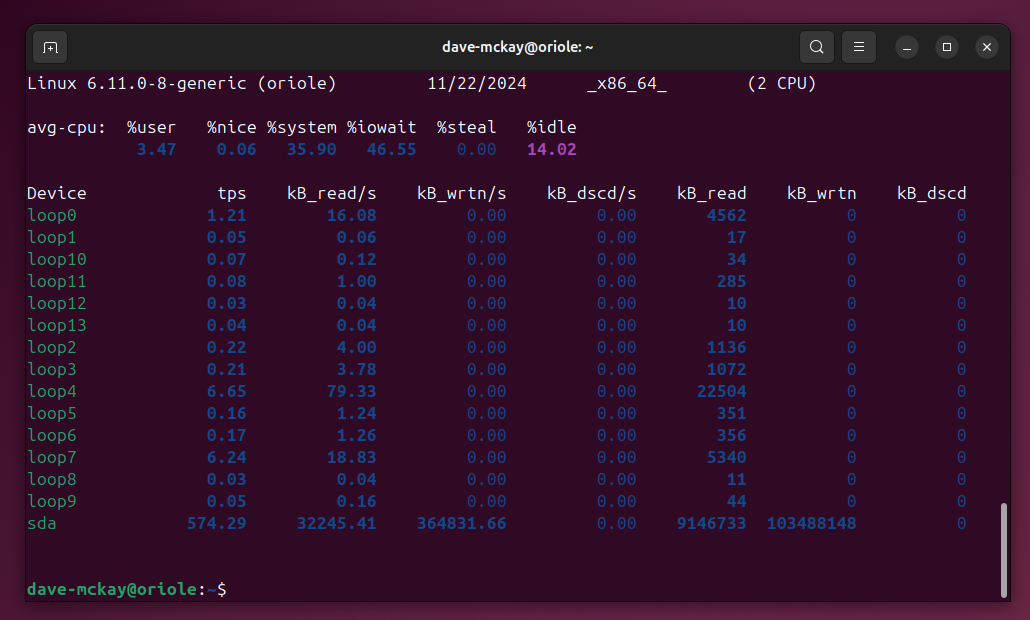
The simplest invocation is the iostat command without any options.
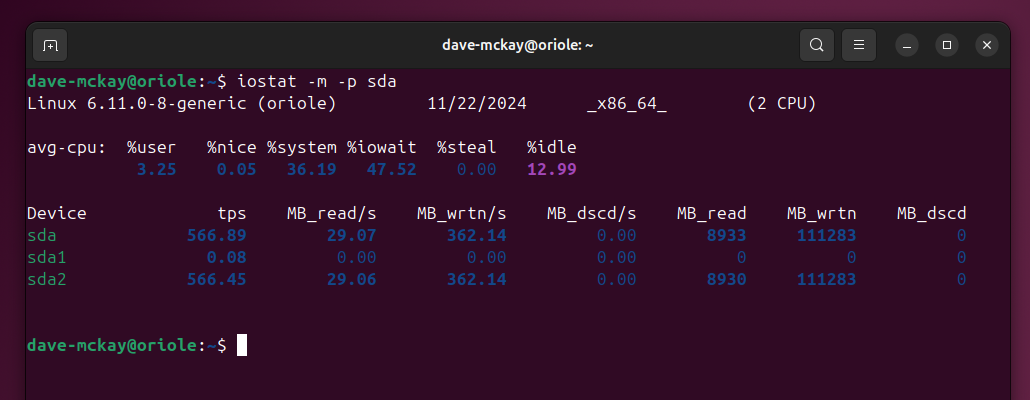
iostat If you’re interested in a single drive, use the -p (devices and partitions) option, and give the device name of the hard drive. You can also obtain the statistics in megabytes per second by using the -m (megabytes) option.
iostat -m -p sda
The report contains statistics about the hard drive and its partitions. To report on a single partition, add the partition number to the hard drive identifier.
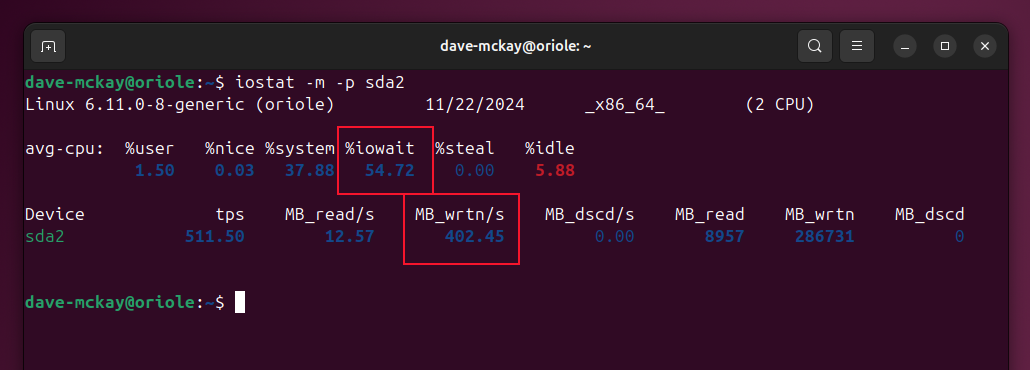
iostat -m -p sda2 The reports contain a line of information about the CPU, and then the details of the selected devices.
For this exercise, the CPU values to focus on are the %iowait and %idle figures. The %iowait figure shows the percentage of time (since booting) that the CPU has been twiddling its fingers waiting for hard drive input/output requests to be serviced, so that it can continue.
The %idle statistic is the percentage of time since boot, when the CPU was idle and there were no outstanding disk input/output requests.
Ideally, the %iowait figure should be as low as possible. This machine is struggling badly because of hard drive performance, and the number of input out requests. We can get more detail by looking at the device and partition information. We can see there’s a lot of write requests being handled by this partition.
A Real-Time View: dstat
Development on the original dstat package stalled several years ago. It has been rewritten and updated as a component of the Performance Co-Pilot package. You’ll need to install this package.
On Ubuntu, the command is:
sudo apt install pcp One Fedora, type:
sudo dnf install pcp pcp-system-tools On Manjaro, use this command:
sudo pacman -S pcp We’ll start dstat, and use the -D (drives) option so that we can focus on our first drive, sda.
dstat -D sda
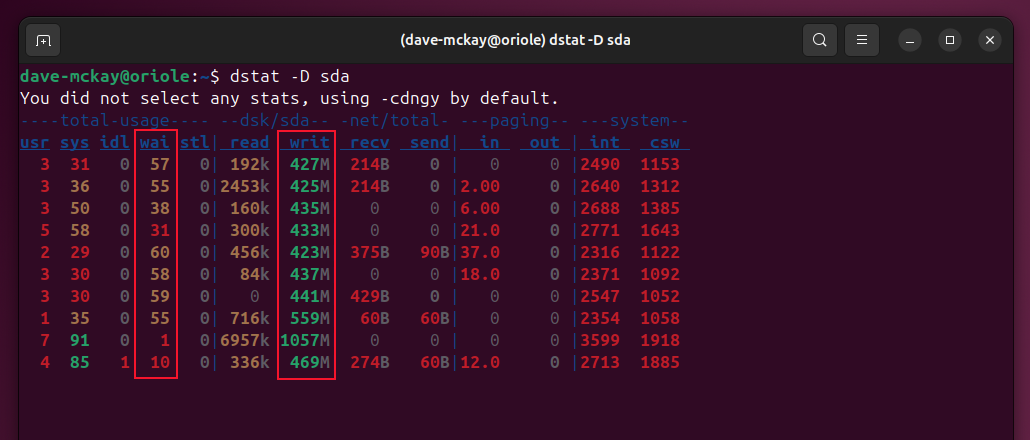
A new line of information is added to the display every half second or so. We can see that there’s a worryingly high waiting time, as before, and a lot of read and write activity.
Because the report updates as you watch it, you can see whether this is a short-term, intermittent, or sustained demand on your hard drive. Hit Ctrl+C to stop the command.
Discover the I/O Latency with ioping
Unless you’ve previously done so, you’ll probably have to install ioping.
On Ubuntu, use this command:
sudo apt install ioping On Fedora, the command is:
sudo dnf install ioping On Manjaro, you need to type:
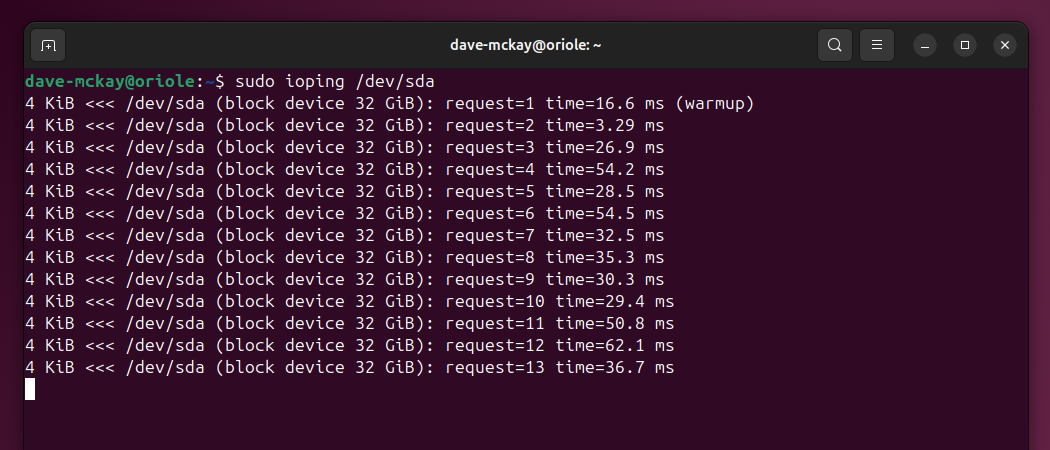
sudo pacman -s ioping Like the ping network tool, ioping returns a timing statistic. It makes a hard drive request and reports how long it took for that request to be acknowledged. The delay before the hard drive responds is the input/output latency. You want this to be as low as possible.
You’ll need to use sudo, because ioping reads directly from the device files associated with the hardware devices. This looks at the first hard drive in our test computer. You can specify a particular partition if you wish, by adding the partition number, like sda1.
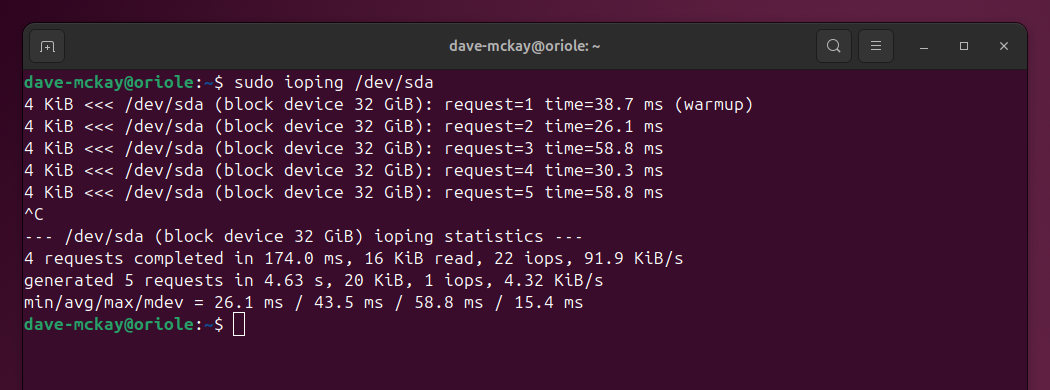
sudo ioping /dev/sda Running the same command on the same computer without the processes that are hammering the hard drive, reported a latency of less than 7ms. The processes that are bombarding the hard drive are slowing response times down by a factor of up to 10 times.
To stop the command, press Ctrl+C. You’ll see a short summary of the session.
Like top For Hard Drives: iotop
Again, iotop is unlikely to be on your computer unless you’ve previously manually installed it.
To install iotop on Ubuntu, the command is:
sudo apt install iotop On Fedora, your command is:
sudo dnf install iotop Manjaro users need to type:
sudo pacman -S iotop The iotop command reads information directly from a kernel API which is restricted to root users, so you need to use sudo to launch the command.
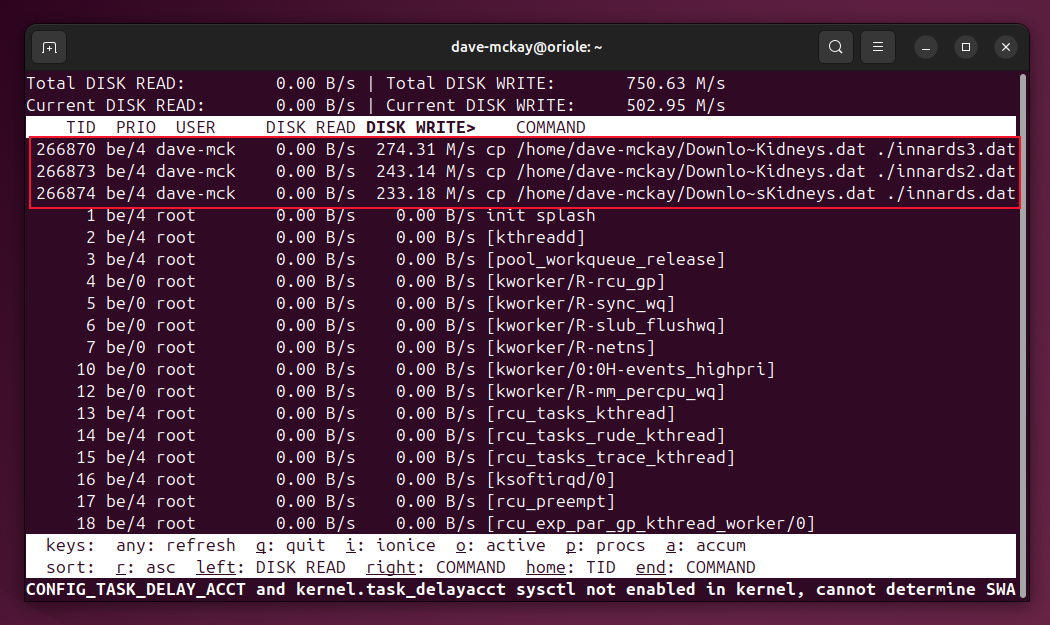
iotop It has something of the look and feel of the regular top command to it. There’s a dashboard of information at the top of the screen, and a dynamic display of processes below it, sorted by Disk Write column. The Left and Right Arrow keys change the column the display is sorted by.
We can see straight away that there are three cp commands generating the majority of the hard drive activity. Usefully, we’re also shown the name of the user who owns those write-heavy processes, and the command they issued to launch them.
Pressing Q closes the application.
Like top For Hardware Devices: atop
The atop command is another top-like tool, but dedicated to reporting on hardware.
To install atop on Ubuntu, the command is:
sudo apt install atop On Fedora, your command is:
sudo dnf install atop Manjaro users need to type:
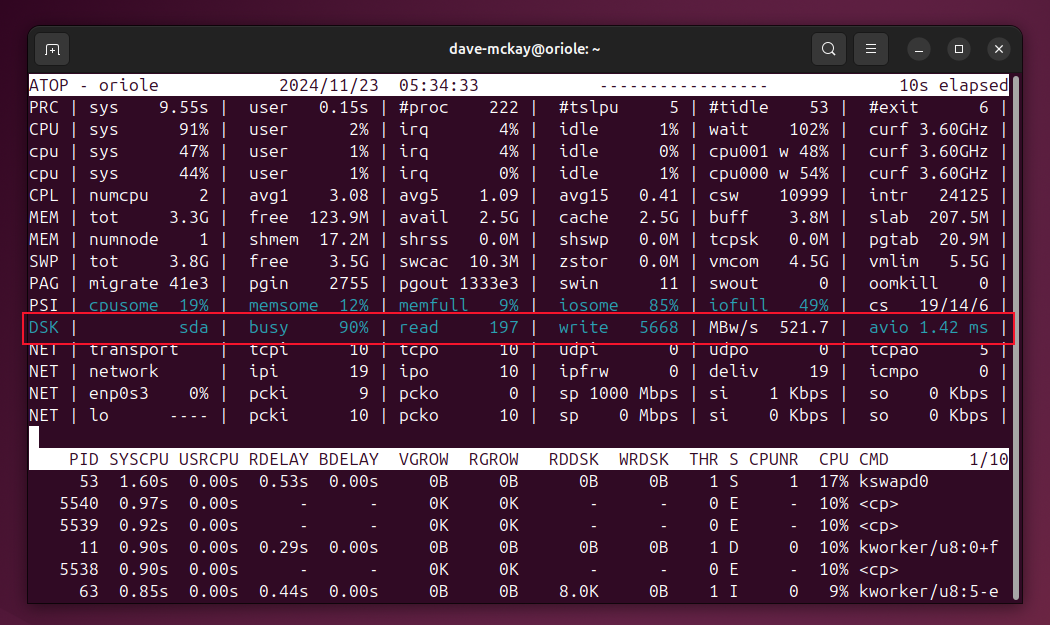
sudo pacman -S atop The first time you see atop it can come as a shock–there’s so much information clamoring for your attention. It looks like a really top-heavy top. You can start atop with or without sudo, but you get a richer and more accurate display if you use sudo.
sudo atop We can see that the hard drive is in use 90% of the time, which is a serious red flag.
Read the Fabulous Manual
All these commands provide you with a rich set of information and options, making them very flexible and useful for troubleshooting. You’re strongly encouraged to read the man pages for the commands that you think you’ll use so you don’t miss out on any cool features.
